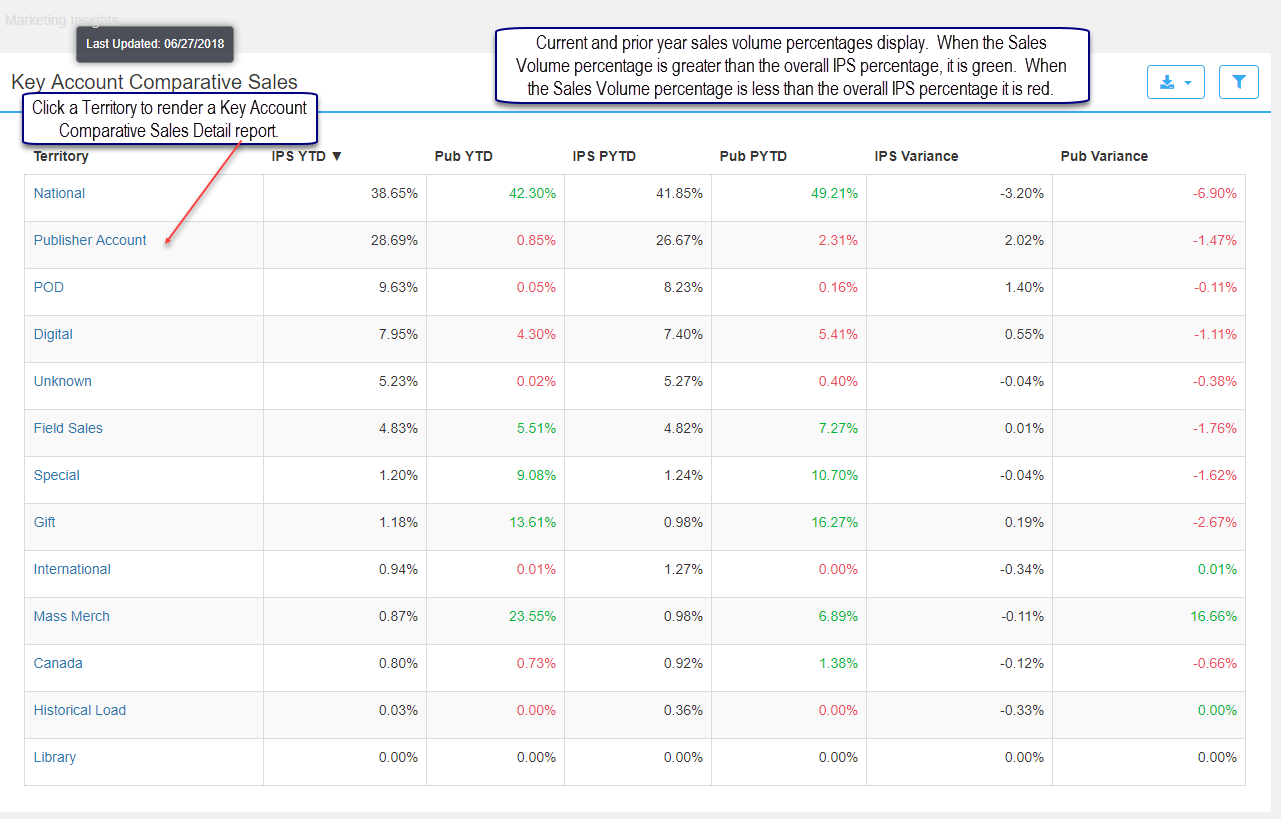
This report compares your net sales percentage by territory to the overall IPS sales percentage by territory. Current and prior year volume percentages display.
When the Sales Volume percentage is is more than 1% better than the overall IPS percentage, the value is green. When the Sales Volume percentage is 1% less than the overall IPS percentage it displays in red.
Click a territory to render a Key Account Comparative Sales Details report which lists the Headquarter Name within the territory and percentage of sales.
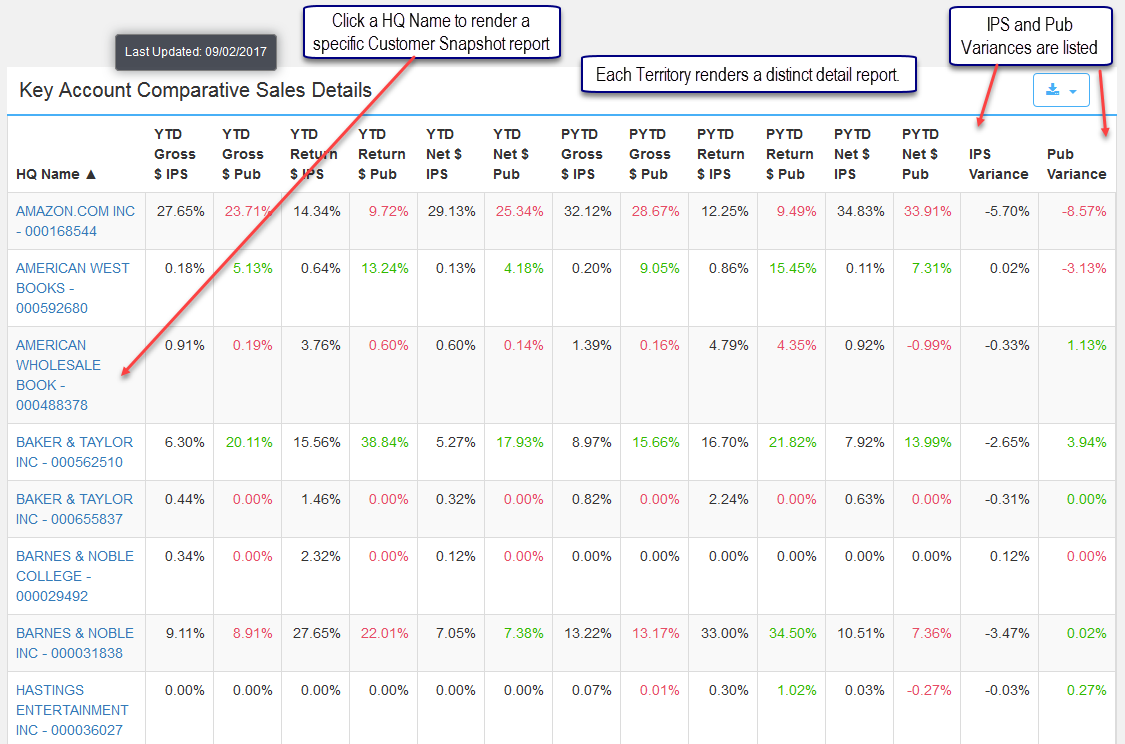
Key Account Comparative Sales Details
The detailed report is rendered by clicking a specific territory and displays sales percentages by Headquarter Name. This report lists IPS and Publisher Gross and Net Sales as well as Returns for the current and prior year. The territory is listed in the Applied Filters section when the report is opened. Clicking a HQ Name links to a Customer Snapshot report.
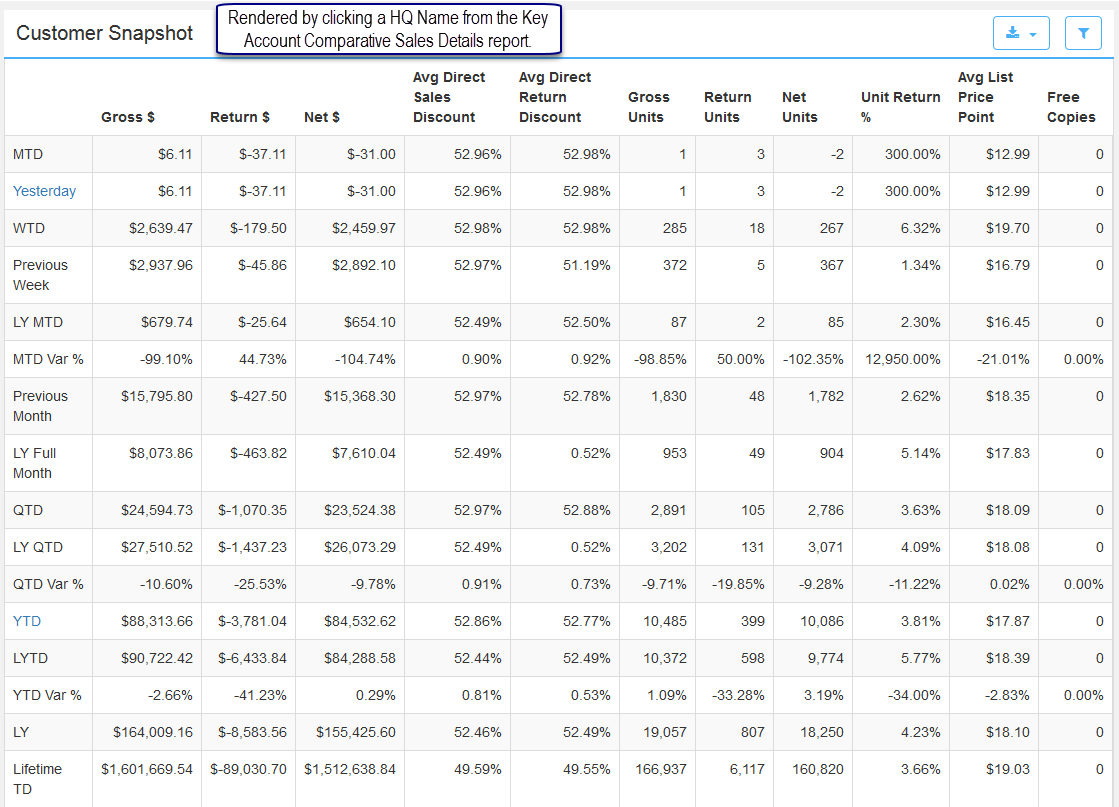
The Customer Snapshot is rendered by selecting a Headquarter Name. Click Yesterday or YTD to drill down further to a Comparative Sales Title report which lists each title in the selected period.
Comments
0 comments
Please sign in to leave a comment.