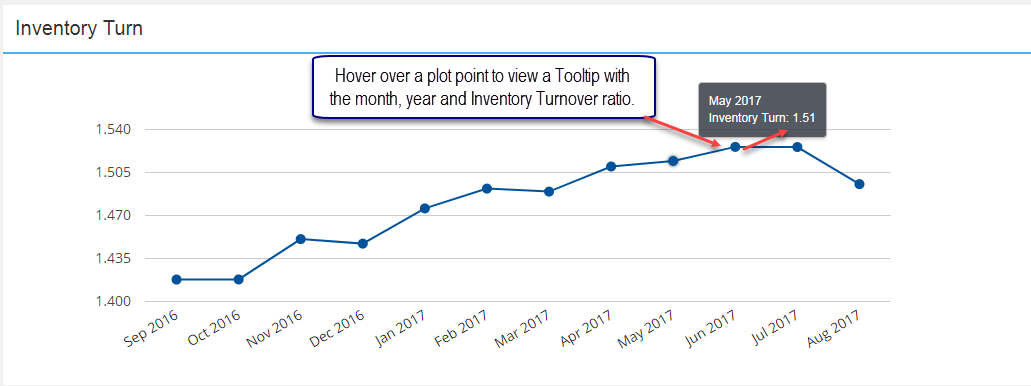
This graph displays inventory turns for the past twelve months. Each month’s inventory turns are calculated by dividing the total units shipped for the prior twelve months by the average ending monthly inventory units for the prior twelve months. Hover over a plot point in the graph to view a Tooltip with the Month, Year and Inventory Turn ratio.
Comments
0 comments
Please sign in to leave a comment.